.jpg)
(043) 705 9000 Available 24/7
(043) 722 0660 Mon-Fri: 08:00 - 16:30
(086) 111 3017 After Hours
(043) 722 1819 (043) 722 1836
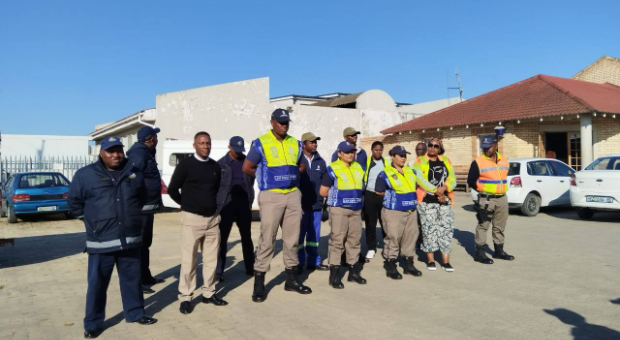
MAYORAL IMBIZOS: DIRECTLY ENGAGING COMMUNITIES Tomorrow, Friday 07 February 2025, will see the last of the Mayoral Imbizos held in Mdantsane at the Sisa Dukashe stadium, at 10h00. During the recent imbizo held in East London this week, Executive Mayor Cllr Princess Faku outlined the vision behind the meetings and what the City plans to do with the feedback received from residents